Competitive AI visibility benchmarking only means something if the comparison is fair. Most teams start by checking whether their brand shows up in ChatGPT or Perplexity, but without standardised prompts, a fixed competitor set, and logged test dates, the results shift too much between runs to trust. Before you can act on mention rates or citation gaps, you need a method that holds still long enough to measure. CMAX works with enterprise teams building that kind of controlled, repeatable visibility baseline across answer engines.
A credible benchmark starts with controlled comparisons.
Standardise Prompts and Competitors
Competitive AI visibility benchmarking depends on controlled comparisons that hold variables constant. That means one prompt library, written once and reused without edits, a competitor set locked before testing begins, and logged test dates recorded for every session.
Without those controls, a shift in how a prompt is phrased or a gap of two weeks between runs can look like a competitive performance change when it’s actually noise. The benchmark needs to rule out those variables before it can say anything meaningful about brand visibility relative to competitors.
Fix the competitor list before you run a single prompt. Adjusting it after early results come in skews the denominator and makes the comparison reflect the market you wanted to see rather than the one you set out to measure.
Competitive AI visibility benchmarking should include Gemini as a tested platform, which is why some teams consult a gemini SEO agency to understand how that engine’s retrieval and citation behaviour differs from other answer engines in the benchmark.
Compare Across Answer Engines
Competitor benchmarking produces reliable results only when it spans more than one platform. ChatGPT, Gemini, Perplexity, and other answer engines can return different brand mentions, different citation patterns, and different answer ordering for the exact same prompt.
Cross-platform testing is what separates a credible competitive benchmark from a single data point. Differences in Perplexity AI SEO behaviour illustrate why single-platform results cannot represent market-wide visibility. If your brand ranks prominently in one engine but goes unmentioned in two others, a single-platform result would have hidden that gap entirely. Market-wide visibility requires market-wide testing.
Competitive AI visibility benchmarking spans multiple answer engines, and understanding GEO generative engine optimisation helps teams account for how retrieval-based systems surface and rank brand mentions across those platforms.
AI Visibility Metrics Answer Different Diagnostic Questions
Separate Core Visibility Metrics
Collapsing all AI visibility data into a single score hides more than it reveals. Each metric in competitive AI visibility benchmarking answers a distinct question, and conflating them produces a readout that can’t tell you where the problem actually is.
Treat these five as separate fields:
- Mention rate, does the brand appear at all across the prompt sample?
- Share of voice, how often does it appear relative to the fixed competitor set?
- Answer position, where in the response does the brand appear when it does show up?
- Sentiment, how is the brand described when mentioned?
- Citation accuracy, does the response link to a relevant, on-topic source, or is the mention unsupported?
A brand can post a reasonable mention rate while sitting consistently at the bottom of responses, or appear prominently but with citations pointing to off-target pages. Neither problem surfaces if the metrics are averaged together. Tracking LLM visibility across these five dimensions reveals exactly where a brand is being surfaced and where it is being passed over. Competitive AI visibility benchmarking produces the diagnostic evidence, mention rate, share of voice, position, sentiment, and citation accuracy, that informs where LLM optimisation efforts should be concentrated to close the gaps identified against competitors.
Use Sample-Level Gap Checks
Raw counts across the prompt sample give you an early read before you score quality. In a 100-prompt sample, 28 brand mentions against 55 for a competitor is a clear signal of underrepresentation, observed in this sample, even before you assess whether those mentions were favourable, prominent, or backed by relevant citations.
That gap tells you the brand is losing surface area. The subsequent metric breakdown tells you why, and it is this breakdown that directs AI engine optimisation work toward the specific weaknesses dragging performance down.
A scored checklist turns snapshots into fair benchmarks.
Score Your Benchmark Checklist
Before you interpret a single result, run your benchmark setup through a scored checklist. The checklist tests whether the comparison is fair, not whether the numbers look good. Six fields need to pass.
Prompt consistency. Every prompt in the sample is written once and reused without edits across all brands and platforms. When outputs differ, that difference traces back to the model response, not to a rephrased question.
Competitor list. The competitor set is fixed before testing begins. Adjusting it after early results skews the denominator and turns a market comparison into a curated one.
Date logging. Test dates are recorded for every run. Without them, a shift in brand mentions could reflect a model update or retrieval change rather than a real competitive move.
Separate scoring fields. Mention rate, share of voice, position, sentiment, and citation accuracy are scored as distinct fields. A combined score can mask a brand that appears frequently but ranks poorly or carries negative framing. Separate fields surface that.
Citation source review. Citation sources are saved alongside results so teams can check whether a mention was backed by a relevant, on-topic page or by a reference that has no direct connection to the query. An unsupported citation inflates apparent visibility without delivering it.
A checklist that passes all six fields gives you a benchmark worth acting on, which is what makes competitive AI visibility benchmarking credible. One that fails even two fields produces a snapshot you cannot reliably compare next quarter.
Prompt clusters are labelled by topic or intent so weak areas can be tied back to specific commercial themes, use cases, or stages of research after scoring.
Build a Stable Baseline First
Before you read anything into the numbers, the benchmark has to prove it can produce the same result twice under the same conditions. That proof comes before trend analysis, not alongside it.
Labelling prompt clusters by topic or intent is what makes that proof actionable. When prompts are grouped by commercial theme, use case, or research stage, a low mention rate in one cluster points directly to a specific gap rather than a general underperformance. A brand that scores well on awareness-stage prompts but disappears in decision-stage clusters has a different problem than one that is absent across the board. The label is what surfaces that distinction.
The baseline locks in the method. When AI services Australia providers build a stable baseline, they prove the method is fair before measuring movement. Once the prompt set, competitor list, platforms, and scoring rules are fixed and verified as consistent, you have a reference point that later runs can be measured against. Trendlines drawn before that method is confirmed reflect noise as much as signal.
Competitive AI visibility benchmarking requires a stable, repeatable baseline before teams can meaningfully engage with the strategic question of aeo vs SEO and decide where to direct content and authority-building efforts.
Ongoing analytics is the right tool for measuring movement. Competitive AI visibility benchmarking is the right tool for establishing whether the comparison is fair and repeatable in the first place. Running both simultaneously before the baseline is stable conflates two separate questions and makes it harder to attribute any change to a real cause.
Lock the method first. Then measure what moves.
Content and Citation Gaps Explain Visibility Losses
Find Coverage and Fact Gaps
When competitive AI visibility benchmarking surfaces a low mention rate, the cause is often structural. Answer engines pull from indexed, citable sources. If a brand lacks dedicated entity pages for the products, services, or use cases covered by the prompt set, the model has less relevant surface area to draw from. Thin source coverage compounds this: a competitor with clear, query-specific pages that map directly to the prompts being tested will consistently outperform a brand whose coverage is broad but shallow. Inconsistent facts across pages create a further problem, as conflicting signals reduce the confidence an answer engine places in any single source.
Competitive AI visibility benchmarking consistently surfaces the same coverage deficits that practitioners address through SEO for AI search, particularly the need for query-specific, citable pages that answer engines can reliably retrieve and attribute.
The diagnostic question after scoring is specific: which prompt clusters show low citation rates, and do those clusters correspond to gaps in published, on-topic content?
Proof Point by Mechanism
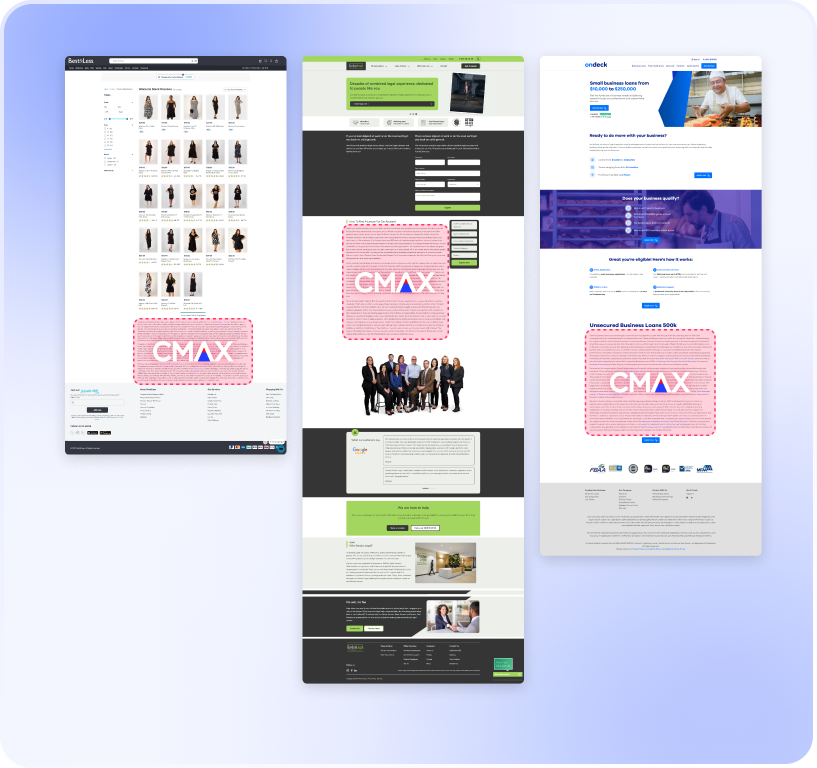
The mechanism is straightforward. Broader query-specific, citable coverage gives answer engines more relevant material to mention and cite. In one CMAX engagement, a B2B omnichannel hospitality retailer added 5,000 long-tail product pages and generated over $1M per month in incremental SEO revenue within 8 months. The same dynamics apply because competitive AI visibility benchmarking often exposes a simple mechanism: each additional page that maps to a specific query is one more citable source an answer engine can surface. For an AI agency Australia teams can rely on for this kind of coverage analysis, the key is broader citable surface area, so content investment can be directed at the queries where underrepresentation is already measured.
Competitive AI visibility benchmarking reveals citation and coverage gaps that connect directly to broader discussions around AI in search engine optimisation, since the same content signals that earn traditional authority also influence whether answer engines cite a brand.
An honest readout shows where to improve first.
Prioritise Overlapping Weak Signals
A single weak metric rarely tells you much on its own. A low mention rate could mean the brand is absent from a specific topic cluster. Weak citations alone might reflect a sourcing gap on one page. What demands immediate attention is when those signals stack: prompt clusters where low mention rates coincide with poor answer position, thin citation support, or negative sentiment are pointing to a structural visibility problem, not a one-off anomaly.
Triage by overlap. If a cluster shows all four weak signals simultaneously, that cluster is where content coverage, authority signals, and citation sources all need attention at once. A thorough SEO AI audit of that cluster will surface the specific gaps driving each weak signal. Fix the cluster with the most overlapping weaknesses before moving to clusters where only one metric is underperforming.
Benchmarking Versus Ongoing Analytics
Competitive AI visibility benchmarking establishes a diagnostic baseline: it tells you where your brand stands relative to a fixed competitor set, across a fixed prompt library, at a specific point in time. That baseline is only credible if the methodology is locked before results are read.
Competitive AI visibility benchmarking establishes the diagnostic baseline, while LLM visibility analytics is the ongoing practice of tracking how that baseline shifts after content and citation improvements are deployed.
Ongoing analytics takes over after the baseline is set. It measures how mention rate, share of voice, position, sentiment, and citation accuracy shift after content coverage is expanded, authority signals are strengthened, or citation sources are corrected. Effective AI content management is what translates those identified gaps into deployed fixes across the right pages and topic clusters. Without a locked benchmark to compare against, those movements have no reference point and cannot be attributed to specific fixes.
Frequently Asked Questions (FAQ)
How do you measure AI search visibility?
Run a standardised prompt set across your selected answer engines and log four things for each response: whether the brand appears, where it appears within the answer, how it is described, and whether the response cites a relevant source. Each of those fields is recorded separately so the data stays diagnostic rather than collapsed into a single opaque score.
How is AI Share of Voice (SOV) calculated?
AI share of voice is a brand’s share of total mentions within the fixed prompt sample and competitor set being tested. If your brand appears in 28 of 100 prompts and a competitor appears in 55, your observed SOV in that sample is 28%. The denominator only stays meaningful when the prompt count and competitor list remain unchanged across runs.
What is a good AI visibility score?
There is no universal threshold. A good score is one that holds up relative to the competitors, prompts, and platforms in your specific benchmark. The more useful question is whether your brand is consistently underrepresented in the prompt clusters that carry the most commercial weight.
Why is tracking AI visibility so inconsistent?
Answer engines can vary outputs by platform, timing, prompt phrasing, retrieval source, and model updates. That variability is why controlled test conditions are a prerequisite before any benchmark result is treated as a fair comparison.
How do you track rankings in AI answer engines?
Log answer position within each response. Treat that position as one signal, not the whole picture. Mention frequency and citation quality sit alongside position because AI outputs do not behave like a traditional ten-blue-links results page, and a brand mentioned third with a strong citation can outperform one listed first with no source backing.
Benchmarking Gaps Don’t Fix Themselves
CMAX is an agentic SEO platform built to capture the long-tail demand most teams never reach.
Our AI agents deploy and continuously update content across thousands of keyword variations, the 90% of search and AI traffic that conventional strategies leave on the table. Two lines of code connect CMAX to your site, and results typically appear within six weeks. When competitive AI visibility benchmarking reveals gaps in mention rate, citation coverage, or share of voice, CMAX gives you the content infrastructure to close them at a speed and scale manual workflows can’t match.
If your benchmarks keep surfacing the same shortfalls, the issue isn’t measurement, it’s capacity.
Author
Jeremy Tang
Founder and CEO of CMAX
Jeremy Tang is the Founder and CEO of CMAX. With over 2 decades of experience in business consulting and digital marketing, he has successfully driven seven startup businesses, six of which achieved $1 million in revenue from zero in less than 16 months, 5 of which grew to multi-million dollar a year ventures without any external funding. Jeremy's expertise lies in streamlining business processes through technology and leveraging digital (in particular SEO) for business growth. He resides in Australia, travels extensively, and draws inspiration from his global experiences.